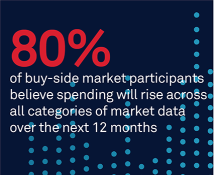
Spending on market data is going up across the board. Among buy-side market participants in our recent study, 80% believe data budgets will rise over the next 12 months, with over one-quarter anticipating a rise of at least 5%. Some categories of market data are growing by 10% or more. Market data spending is clearly on a roll.
This upward trend in spending reflects more than just the annual increases baked into contracts—it reflects strong underlying demand. At the same time, the vast majority of study participants select their data providers based on overall data quality rather than price. This has allowed market data providers to keep premium prices intact, as long as they continue to deliver the highest quality data with little or no down time and, in some cases, with increasing breadth and depth.
That’s not to say cost doesn’t matter. Cost always matters, but decision-makers do not place it at the top of their lists. Moreover, how spending decisions are made varies greatly from firm to firm. Our research shows that decisionmaking is centered in business units on the buy side, as well as heavily influenced by regional considerations (especially on the sell side). For buyers, willingness (and ability) to spend depends heavily on the growth trajectory of investment and trading strategies focused on the asset class (e.g., equities vs. fixed income) and the inherent uniqueness of the data (e.g., alternative data for making investment decisions). In addition, the prioritization of real-time data to enhance trading strategies and operations is a real phenomenon, but not always necessary for different use cases.
This demand for data quality, paired with a willingness to spend, results in a robust market for market data that shows little (if any) signs of slowing.
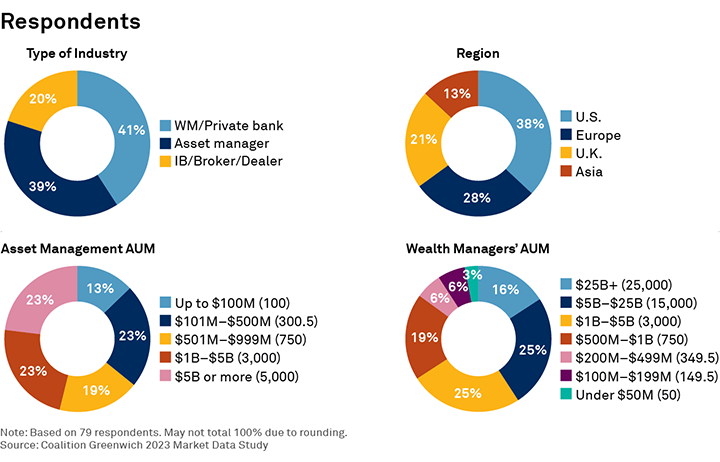
MethodologyDuring April and May 2023, Coalition Greenwich, in partnership with SIX, interviewed a total of 79 global buy-side and sell-side market participants to confirm what drives their choice of market data vendor, what types and frequency of data these firms are buying and consuming, and their views on anticipated future use cases, sources and delivery. The majority of opinions came from professionals working at either asset management firms or wealth management firms/private banks, with experts at dealers and banks making up the balance. Nearly half of asset management firms in our study reported AUM of at least $1 billion, with about one-quarter of that group reporting AUM of at least $5 billion. Likewise, respondents tended to work for larger wealth management firms/private banks, over half of which had AUM of $1 billion or more.
Looking across regions, the majority of participant business is conducted in the U.S., followed closely by Europe. The U.K. and APAC make up a smaller piece of the pie. While buy-side firms are distributed across all regions, nearly all sell-side respondents—which primarily consist of large global banks and dealers—conduct the majority of business in the U.S.

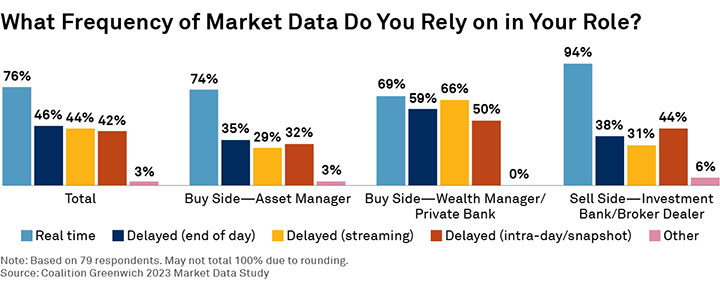
In most cases, participants hailing from buy-side firms have between one and 25 people within their area of responsibility or business function using market data. On the sell side, this figure was often much higher, with nearly one-third of participants pointing to over 100 people using market data. When it comes to the frequency of data being used, real-time data stood out from other frequencies as the preferred data type for both buy-side and sell-side study participants. As the market environment becomes more volatile and unpredictable, the value of real-time information grows and is leading capital markets professionals to increasingly rely on higher frequencies of information.


