Table of Contents
Executive Summary
Fixed-income markets are the lifeblood of the global economy. Access to credit—in other words, the ability to borrow money—played a major role in society’s evolution over the past 500 years and continues to support innovation for economic and social advancement today.
Modern fixed-income markets are multifaceted, with lending made available in many forms (i.e., bonds and loans) and via a variety of lenders, from traditional banks to long-term investors to emerging technology companies. While the underpinnings of these markets can feel complex, understanding why they exist, how they have evolved over time and how these markets operate today is crucial to ensure they remain robust and effective going forward.
To that end, this research examines the core segments of the fixed-income markets, with a focus on bond markets, the size of those markets, their market participants, and the mechanisms in place to both invest in and trade those products.
Introduction
Fixed-income markets are the picture of diversity. The variety of markets, products and market participants creates an ecosystem that allows corporations to grow, governments to finance themselves efficiently, investors to gain fixed returns with lower risk, communities to build infrastructure, young families to buy houses, and you to buy your cup of coffee in the morning.
The last decade has seen fixed-income markets become truly global. While local regulations, cultural differences and a tendency for many to invest where they live create some regional differences, the globalization of the largest banks, asset managers, hedge funds, and corporations has driven the growth of a market that allows money to truly flow to those who need it from those willing to lend it.
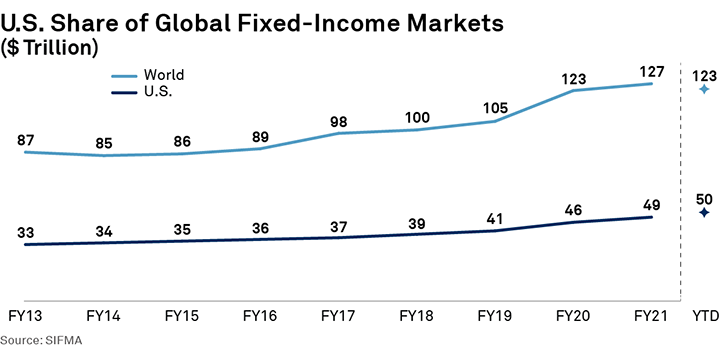
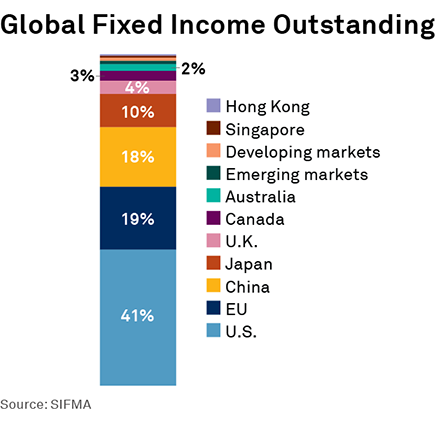
The U.S. fixed-income markets are the largest in the world, comprising 41.3% of the $122.6 trillion of securities outstanding across the globe, or $50.6 trillion (as of 2Q22). This is 2.2x the next largest market, the EU. U.S. market share has averaged 38.9% over the last 10 years, bottoming at 37.5% in 2013 and peaking last year.
The U.S. fixed-income markets include a wide array of products, from government bonds to corporate bonds, and interest-rate swaps to structured products (please see the Appendix for the U.S. fixed-income landscape). For good reason, each sub-market or sector has its own market structure suited to its participants, liquidity and overarching regulations. Some sectors appeal more to institutional investors, such as banks and pension funds. Others, including the municipal bond market, attract more retail investors.
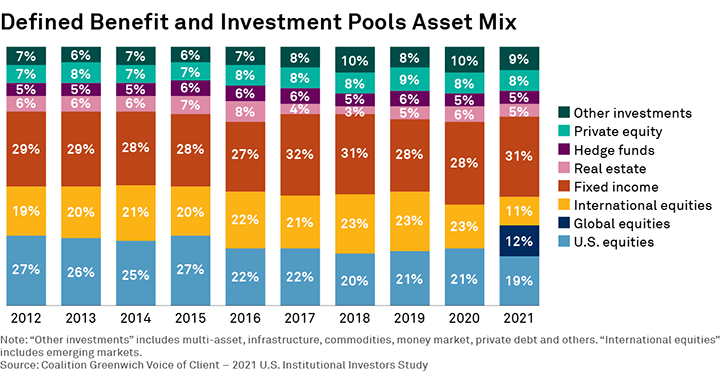
The global fixed-income market was worth over $122.6 trillion as of 2Q22.1 Over the past 10 years, this market has consistently accounted for nearly one-third of U.S. pension fund assets,2 acting as the portfolio’s foundation to ensure steady asset growth that brings millions through their retirement years. And while declining bond values in 2022 have hurt the value of many portfolios, higher global interest rates have conversely made bond market investments an even more attractive long-term, income-producing investment.
Grasping how the various components of the fixed-income markets work and how they interact with one another is not trivial. Nor is identifying the “right” path forward to ensure the growth and efficient functioning of the global fixed-income markets. However, by recognizing the utility of these markets to the real economy, the goals of the market participants involved, how regulators help protect investors, and how the markets have evolved over time, the path forward becomes increasingly clear.
An Overview of Fixed-Income Markets
The fixed-income markets, simply put, provide a means of borrowing money that allows those that need capital to borrow from those that have it, with the lender being compensated through interest payments. Unlike equity markets, fixed-income offerings/borrowings require the borrower to return the money to the lender at a pre-agreed point in the future.
The simplest form of borrowing is a loan. For example, an electric-car manufacturer takes out a loan from a commercial bank to buy the raw materials to make batteries. The bank wires the money to the manufacturer, and the manufacturer makes periodic payments that include both principal (actually repaying the loan) and interest (the fee charged by the bank for lending the money). The bank makes money from the interest charged (which is effectively a “fixed income”), and the principal loan amount allows the car manufacturer to make more, hopefully profitable, cars.
Having only two counterparties in a transaction doesn’t always work, however, which is why the fixed-income markets evolved. The fixed-income markets allow a corporation, government or other entity to borrow by selling bonds to many investors that, in aggregate, lend the amount of money the entity needs to borrow. These entities can also borrow via a more traditional loan, but that loan can be from multiple lenders (a syndicated loan) and/or sold to other investors interested in receiving the interest payments from the borrower.
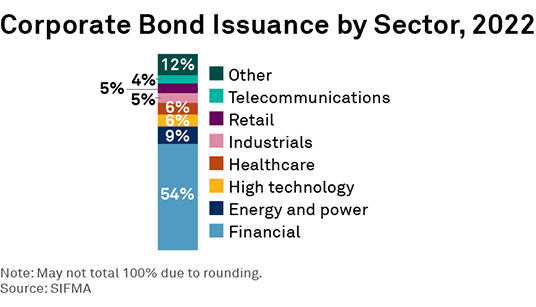
Such transactions both increase the pool of money available to the borrower and spread the resulting credit risk across a wide range of investors that desire to hold this risk (rather than leaving it all with a single bank). For example, companies in the auto sector issued $8.25 billion in corporate bonds in 2022 alone.3
Bonds have a long history. In fact, the first government bonds were issued by the Bank of England in the late 1600s to finance a war against France. American colonies and the Continental Congress issued bonds to finance the Revolutionary War. After independence, the newly formed American government issued bonds to redeem outdated Continental currency. The modern U.S. government bond market got its start over 100 years ago during World War I.
The U.S. Government Bond Market
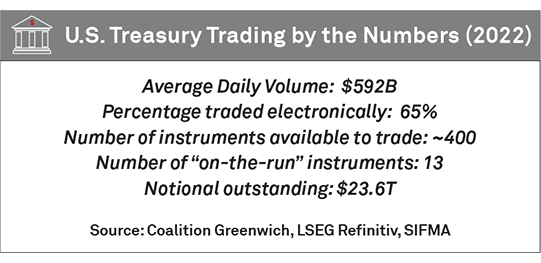
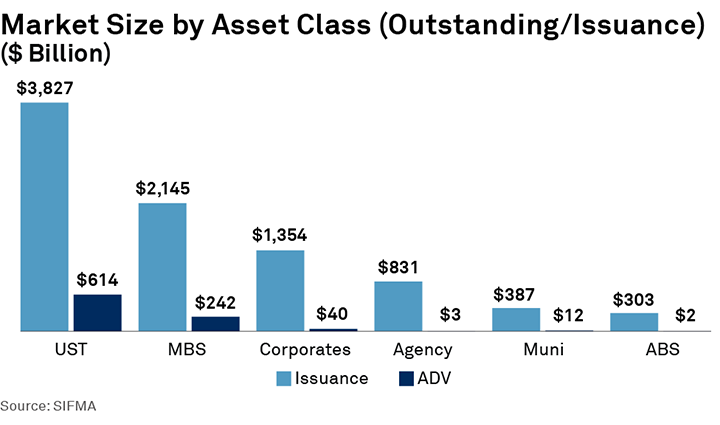
Today, the U.S. government bond market is the most liquid and efficient fixed-income market in the world. The interest rate paid by the U.S. government to its borrowers is considered to be the “risk-free” rate and is a benchmark for millions of securities and other kinds of transactions around the world. In 2022, an average of $590 billion of U.S. Treasury bonds were traded each day, with 65% of that volume traded electronically.4 On March 13, 2023, a record $1.49 trillion of U.S. Treasury bonds were traded in a single day.
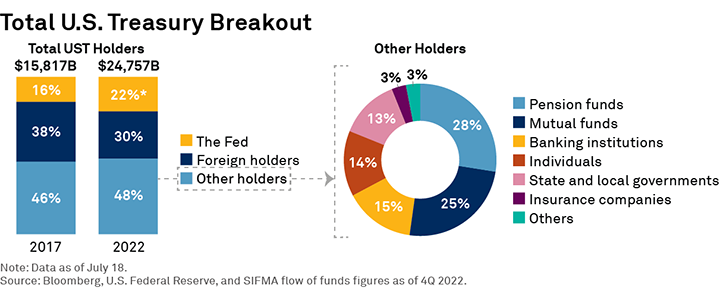
The $22 trillion lent to the U.S. government at the end of 2022 comes from a diverse set of investors. Foreign governments and monetary authorities, including the U.S. Federal Reserve (the Fed), hold 60% of this amount, with private investors, both institutional and retail, holding about a third. While this distribution has changed over time, along with interest rates and global economic conditions, large governments and individual investors around the world continue to see U.S. government debt as a sure thing, hence, the status of U.S. Treasury rates as the risk-free rate.
U.S. Agency Debt Market
U.S. agency bonds are debt securities issued by government agencies and government-sponsored enterprises (GSEs), such as Fannie Mae, Freddie Mac and the Federal Home Loan Banks. These entities were created by Congress to increase the availability of credit for specific sectors of the economy, such as housing, agriculture and education. U.S. government guarantees, and whether they are implicit or explicit, depend on the issuing agency. Some of these agencies also issue mortgage-backed securities (MBS), which are discussed further below.

The Credit Markets
The U.S. government and agency debt markets are referred to as the “rates” markets, as the primary risk faced by bond holders is interest-rate risk. The government debt of other major markets around the world (e.g., the United Kingdom, Germany, Japan) also falls into this category.
Holders of most other debt, including corporate bonds, municipal bonds, private mortgage- and asset-backed bonds, syndicated loans, and some sovereign debt (i.e., from emerging markets), must manage not only the risk of interest rates moving, but also the probability of the borrower defaulting—or credit risk.
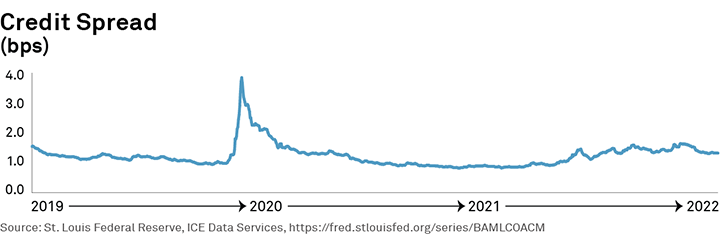
Credit markets are critical to the growth of the U.S. economy. This is where corporations, municipalities, finance companies, banks, and others borrow money to expand their businesses. Credit markets generally provide higher yields than rates markets (the credit spread), because bonds expose investors to credit risk. Times of market stress, such as March 2020, can cause this premium to jump, given the higher risk of default. But this risk/reward interaction between borrowers and investors incentivizes lending to both lower- and higher-risk entities.
Municipal Bonds: Municipal bonds are issued by state and local governments and by government agencies and authorities principally to finance investment in infrastructure, such as schools, roads, airports, transit systems, water and sewer systems, public hospitals, and similar projects. A key feature of most municipal securities is that the interest earned by investors is exempt from federal and, in some cases, state and local income tax. This further lowers the borrowing cost for municipal issuers. With more than one million distinct municipal bonds outstanding, the efficiency of the municipal market allows governments to borrow for long terms at low interest rates, saving money for tax and rate payers.
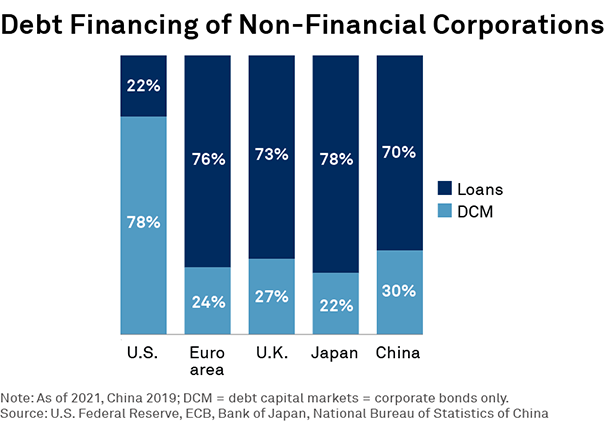
Corporate Bonds and Loans: Corporate borrowing via the credit markets is done through several different vehicles, corporate bonds and syndicated loans chief among them. Data from SIFMA shows more than three-quarters of debt outstanding among U.S. corporations is in corporate bonds, with the balance in the loan market. European and Asian corporations tend to favor the loan market. It’s important to note that unlike corporate bonds, loans are not securities per U.S. rules.
In most cases, corporate bonds are issued with a fixed interest rate, whereas loans are made with a floating interest rate. Corporations work with bankers to decide which structure works best for their specific situation, taking into account things such as the firm’s credit rating, debt already outstanding, investor appetite for the borrowing vehicle in question, and the direction of interest rates.
The creditworthiness of the borrower also plays a big role. Ratings agencies such as S&P Global use a ratings scale with 10 rungs, from AAA (the most creditworthy) to D (a major risk of default). The top five ratings are commonly referred to as investment grade (or high grade), and the bottom five as high yield. These distinctions are important not only for investors and lenders, but also for traders, as investment-grade and high-yield bonds have different trading dynamics and pricing conventions.
Private Credit: While the majority of this lending is done via banks, the market for private credit, or nonbank lending, has increased notably in recent years. This market involves non-traditional lenders, such as private equity or fintech firms lending money to corporations via private loans. The different business models of these lenders can make some borrowers more attractive to them than they would be to traditional banks. Data from Preqin shows the market for private credit rose to $1.4 trillion at the end of 2022.5
Securitized Products
Individual retail-size loans and lines of credit (e.g., via credit cards or car loans) are not always attractive to institutional investors, given the burden and cost associated with servicing hundreds or thousands of distinct assets. When packaged as collateral for bonds supported by their cash flows, however, their attractiveness as institutional investments changes dramatically.
These securitized loans, packaged and sold as bonds, are easily traded and held by institutional investors, allowing retail consumers to get reduced-cost access to the credit they need. They also offer institutional investors the opportunity to diversify their portfolios beyond traditional corporate and government bonds.
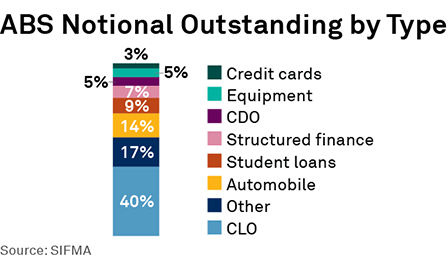
Securitized products, also known as mortgage-backed securities or asset-backed securities, come in as many varieties as the underlying debt that they help to fund.
Mortgage-Backed Securities (MBS)
Fannie Mae, Freddie Mac and Ginnie Mae securitize mortgages and guarantee payments to investors (also known as agency mortgage-backed securities, or agency MBS), which ultimately lowers mortgage rates for home buyers. In fact, agency MBS fund the majority of U.S. mortgages—roughly 70%. Mortgage TBAs (To Be Announced) are contracts for the purchase or sale of a specified dollar amount of mortgage-backed securities with a predetermined settlement date and a generic description of the securities to be delivered. The TBA market is one of the most liquid fixed-income markets in the world. While Fannie Mae and Freddie Mac buy and securitize mortgages themselves, Ginnie Mae does not securitize loans but instead guarantees payment of principal and interest of MBS collateralized by qualifying loans (those insured by FHA, VA or USDA), also helping keep mortgage rates down.
Securitization provides funding for commercial borrowers as well. Commercial mortgage-backed securities (CMBS), for instance, securitize loans made to buy commercial real estate, allowing business owners to borrower at lower rates.
MBS and CMBS may also be issued by private-sector issuers. This kind of MBS, commonly called private-label MBS or non-agency MBS, typically securitizes loans that are not eligible for the agency issuers, or loans that are otherwise most economically issued by private sector participants such as banks, finance companies or other entities. In contrast to agency MBS, these privately issued MBS do not have implicit or explicit government guarantees.
Asset-Backed Securities (ABS)
Major banks (and increasingly nonbank lenders) also securitize various types of consumer credit, including student loans, car loans, credit card debt, and others, in addition to mortgages. These products, while not guaranteed by the U.S. government, reduce borrowing costs for end consumers by increasing the number of investors interested and able to lend them money. They also allow lenders to transfer risk to willing end investors, allowing them to raise new capital to meet future lending demand.
Collateralized Loan Obligations (CLOs)
Collateralized loan obligations (CLOs) are typically managed funds that buy syndicated loans and then pass on the principal and interest payments to investors in those funds. In fact, CLOs have become some of the biggest buyers of syndicated loans—in other words, some of the biggest lenders. The CLO market is closely related to the private credit market discussed above.
Derivatives
While this research is focused primarily on bonds, it is important to understand the critical role that derivatives play in the fixed-income markets and real economy. Derivatives, such as interest-rate and credit-related swaps, futures and options, are used by companies and financial institutions mainly to hedge risk. Such hedging enables lenders to extend more credit to companies, which then funds job creation and economic growth. Corporations may use derivatives to hedge pension plan obligations or manage the interest-rate risk associated with their bond offerings.
Without these critical tools, the risk of an interest-rate or credit move could increase companies’ cost of borrowing or risk of default, which would negatively impact their investors, employees, customers, and their ability to create jobs and grow.
Trading Fundamentals
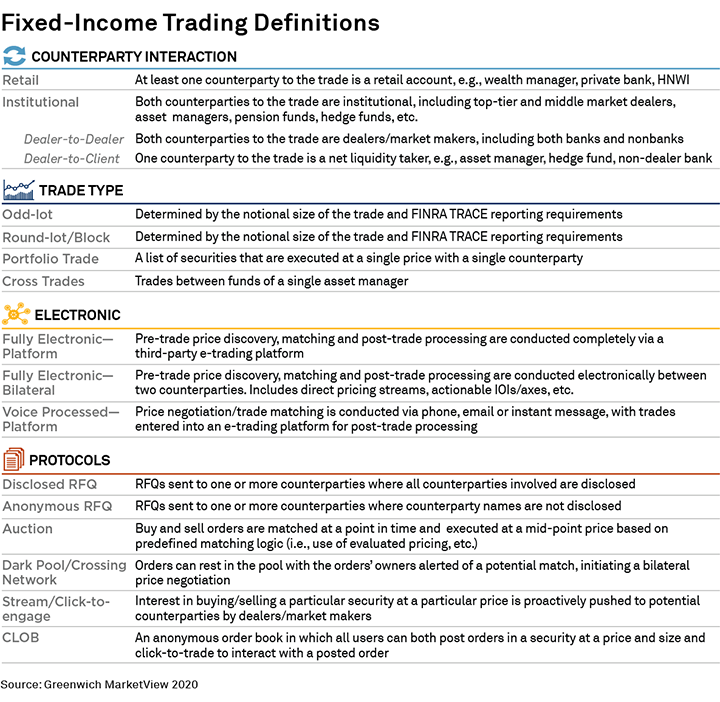
The universe of fixed-income instruments utilized by market participants is diverse, and so too are the mechanisms used to trade them. Fixed-income trading in the 20th century was almost completely conducted via phone conversations. A financial or corporate end user who needed to buy or sell a fixed-income instrument had to call several broker-dealers to express their interest, wait to receive bids or offers from each, and then select the right counterparty based on those prices and other factors. This process was almost completely manual on both sides of the phone, from order entry to price creation to trade booking.
While this bilateral process still exists today, particularly for large, complex and/or illiquid orders, the fixed-income market as a whole is undergoing a digital transformation that aligns with that of the broader global economy. But while the trading process has digitalized broadly and market transparency has grown, the exact scale and nature of this electronification varies considerably across the fixed-income product landscape.
This variability is not because of market (un)willingness or the focus of technologists but, instead, because the different nature of these instruments—market size, market turnover, market participant types, instrument uses, and regulatory oversight—has driven the creation of trading protocols, reporting regimes, data, and workflows that are best suited to each individual market’s unique structure.
Trading Mechanisms and Definitions
U.S. Treasuries
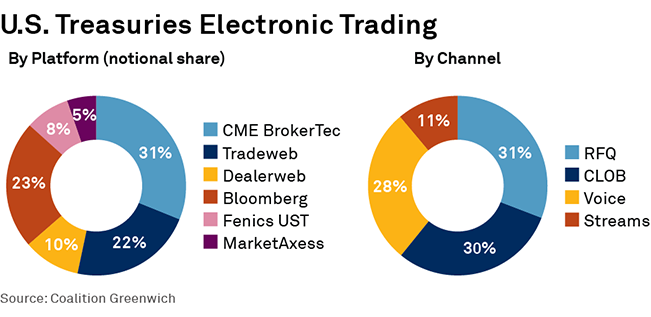
Coalition Greenwich data shows that two-thirds of U.S. Treasury trading (by notional) was traded electronically in 2022, making it the most electronically traded fixed-income market in the world. Put in notional terms, over $400 billion of Treasury securities trade electronically on any given day. Coalition Greenwich data shows that roughly 30% of U.S. Treasury trading is done via the request for quote (RFQ) model, with 25–30% executed via a central limit order book (CLOB). This mix changes depending on market volatility and other macroeconomic conditions.
While the U.S. Treasury market is generally considered the most liquid in the world, it is important to note that the most recently issued bonds (called on-the-runs) accounted for 70–75% of market volume, whereas older bonds (called off-the-runs) accounted for only a quarter. As such, the liquidity profile of off-the-run bonds is quite different, leaving buyers and sellers of those bonds to transact more often via non-electronic methods in an effort to find a buyer or seller, since liquidity on the screen can be limited.
Corporate Bonds
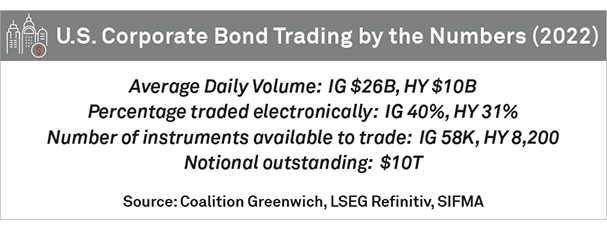
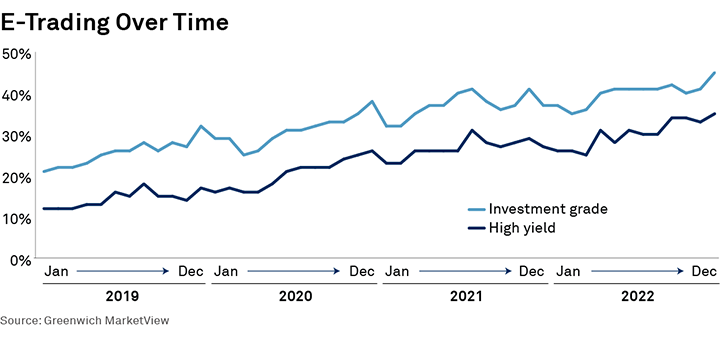
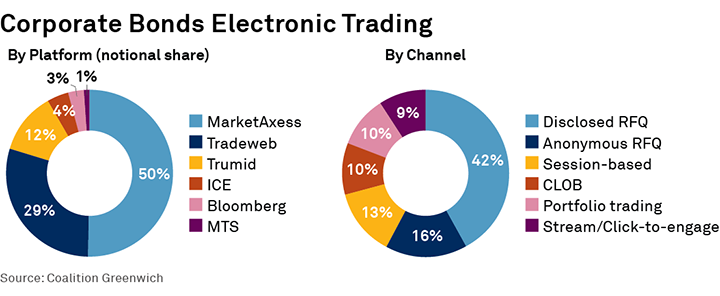
U.S. corporate bonds have experienced strong growth in electronic trading that was initially triggered by the global financial crisis of 2008–2009 and then further catalyzed by the work-from-home trend brought about by the COVID pandemic. Roughly 40% of investment-grade and one-third of high-yield corporate bonds now trade electronically, both metrics having doubled in only the past three years. Market turnover has grown overall as well, averaging $36 billion per day in 2022.
About 60% of corporate bond e-trading is executed via the RFQ protocol, most between institutional broker-dealers and large investment managers. The majority of trading for retail investors happens via a CLOB, which accounts for 7% of market volume. The electronic market’s growth overall has come less from these traditional methods of e-trading and more from trading mechanisms new to the corporate bond market, such as auction/session-based trading and portfolio trading.
Municipal Bonds
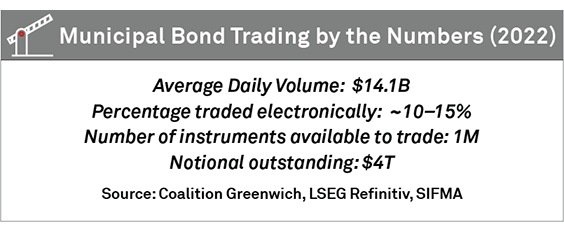
Municipal bond markets see trading of roughly $15 billion per day, depending on market conditions, with less than 15% traded electronically. While municipal bond markets have seen some e-trading innovations over the past few years (e.g., automated market markers, real-time evaluated pricing), they remain behind U.S. Treasury and corporate bond markets. The larger number of tradeable instruments (over 1 million), the buy-and-hold nature of the retail investors, and the regional nature of the market (most retail investors buy bonds only from their home state for the tax advantages) are factors that continue to keep the market relatively illiquid and with a relatively high percentage of phone-based trading.
Mortgage-Backed Securities (MBS)
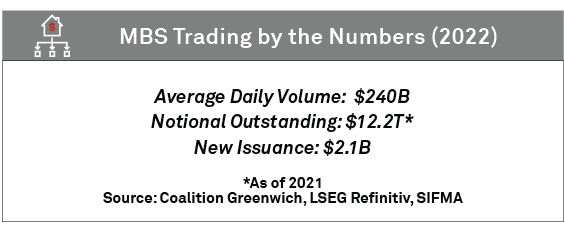
The agency MBS market is one of the most liquid fixed-income markets in the world, with $240 billion trading per day on average in 2022. While most trading is still conducted via phone or chat, technology provided by some fixed-income trading platforms are heavily used and create a streamlined trading process.
Asset-Backed Securities (ABS)
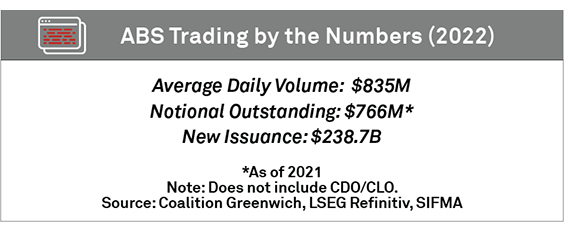
Just over $800 million in ABS trade per day on average, with those backed by auto and credit card loans the most heavily traded. ABS trading is still largely done via bilateral channels, with electronic trading still a relatively small part of the market.
Comparing Bond and Equity Trading
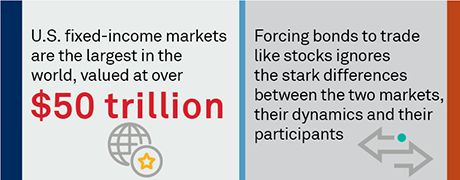
Talk of “equitizing” the bond markets—the idea of making bonds trade more like stocks—has been pervasive for at least the past decade. And while the bond markets have certainly become much more electronic in recent years via natural forces, it is the diversity of trading mechanisms (each suited to the needs of each market and its participants) made possible by innovative workflows and technology that has allowed the markets to grow and thrive. Forcing bonds to trade like stocks, primarily in anonymous CLOBs, ignores the stark differences between the two markets (and among the different segments of the fixed-income market), their dynamics and their participants.
For instance, there are currently 66,000 U.S. corporate bonds available to trade, which compares to about 4,500 U.S. listed stocks. While Ford’s equity can be traded through its primary equity listing (F), trading Ford corporate bonds requires selecting among the over 200 outstanding issues. To take the point one step further, the municipal bond market and MBS/ABS market each contain just over one million tradable bonds. Many of these bonds, both corporate and municipal, are often bought as long-term investments and held until maturity.
This severely limits trading in those bonds, with many bonds going months or longer without trading. This makes it much more difficult to value a bond compared to an actively traded equity security. As a result, maintaining an order book with active prices for all bonds is difficult if not impossible.
It is also important to note that retail investors are an important presence in equity markets, whereas bond market activity by retail investors is limited (with municipal bonds the only exception). Case in point, 23% of U.S. household investable assets were held directly in stocks in June 2022, compared to only 3% in bonds. This means that the majority of bond market transactions are between professional traders and investors, who then have the wherewithal to utilize different trading mechanisms based on their unique needs.
Market Transparency
The days of opaque bond markets are behind us. A combination of regulatory-driven reporting requirements and private sector investments in technology has made U.S. Treasury, corporate bond, MBS, ABS, and municipal bond markets more transparent than at any time in history. Major market participants must report their bond trades on a real-time basis to the Financial Industry Regulatory Authority (FINRA), or Municipal Securities Rulemaking Board (MSRB) in the case of municipal bonds, which then disseminates trading information to market participants in accordance with FINRA’s/MSRB’s rules governing each product. Even for those bonds that trade less frequently, several large market data providers now offer both real-time and end-of-day evaluated prices for nearly every bond available to trade.
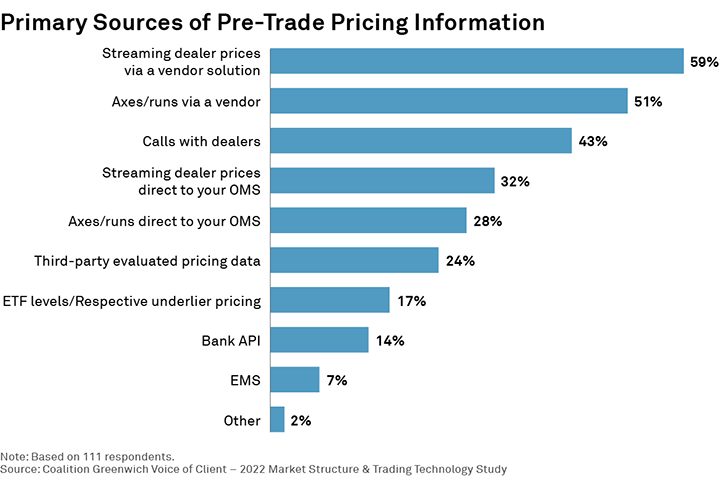
Investors continue to use the dealers to obtain bond pricing information as well. Dealers provide this pricing information via several mechanisms, including real-time streaming prices, reports listing bonds they are interested in buying/selling (aka axes and runs) and via direct phone calls. Technology in recent years has made this pre-trade pricing data much more readily available and actionable than it was only a few years ago. In most cases, where investors look for this information depends largely on the circumstances of each order (i.e., how liquid the bond is, risk of information leakage, etc.).
Electronic trading has been both a cause and effect of this newfound market transparency. The availability of data is a precursor for many market makers and investors to enter a market, especially those whose business is driven by quantitative models. And as those firms have entered the market, the increased trading activity they have brought with them has generated more pricing signals, which, in turn, attracts more market participants. This virtuous cycle that was set in motion a decade ago shows signs of continuing to accelerate in the years ahead.
Market Oversight
Regulatory oversight of the bond markets, whose largest components are U.S. Treasuries, U.S. corporate bonds, agency MBS, non-agency MBS/ABS, and municipal bonds, has increased notably over the past decade. The “flash rally,” a moment on October 15, 2014 that saw U.S. Treasury prices jump notably in a matter of minutes only to return to their starting point shortly thereafter, and the market volatility of March 2020, when COVID lockdowns began, acted as catalysts for regulators to re-examine the structure of the U.S. bond market in search of increased market transparency, efficiency and stability.
Current rules require all broker-dealers who participate in the fixed-income markets to be registered with the U.S. Securities and Exchange Commission (SEC) and one or more self-regulatory organizations (SROs), such as FINRA or MSRB. The SEC makes rules governing dealer and, in some sectors, issuer participation in the securities markets. These rules cover issues such as fraud, capital requirements, trading activity, margin lending, and disclosure, among many others. The SEC also oversees mutual fund companies and registered investment advisors.
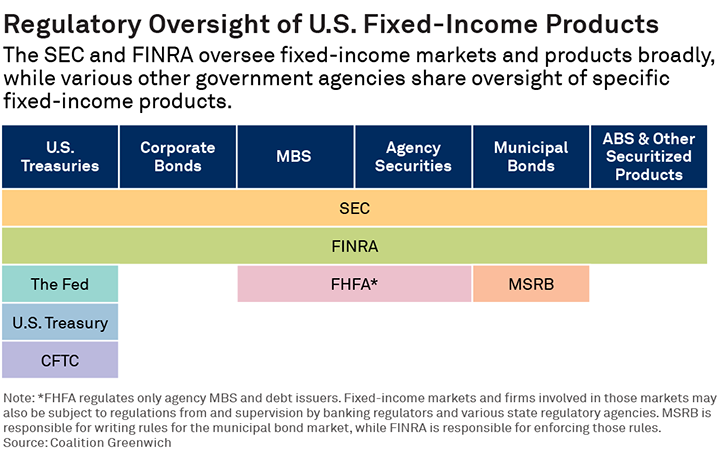
SRO rules cover areas such as suitability, pricing, interaction with investor customers, and professional qualification testing. The SROs are also critical to market transparency. FINRA operates TRACE, the trade price reporting mechanism for U.S. Treasury, U.S. corporate bond, agency MBS, and non-agency MBS/ABS, while MSRB collects municipal securities market information through the Real-time Transaction Reporting System (RTRS) it displays on its EMMA transparency site.
The U.S. Treasury Department unsurprisingly plays a major role overseeing the trading of U.S. government securities. Bank regulators, including the Fed, the Office of the Comptroller of the Currency (OCC) and the Federal Deposit Insurance Corporation (FDIC), make rules that govern bank and bank holding company participation in the markets, including areas such as capital and liquidity. Banking regulators, including the OCC, examine banks active in the bond markets with regard to compliance with SEC and SRO rules.
What’s Next for Fixed-Income Market Structure?
Despite this existing strong market oversight, fixed-income market regulations must evolve alongside the technology and trading mechanisms that have driven the markets’ growth. Today’s bond markets are considerably more electronic, include more global participants and handle much higher trading volumes than the bond markets that existed when many of the current rules were written.
That said, new and modified regulations must be thoughtful and measured. We do not have the benefit of shutting the market down and creating a new market structure from scratch. As such, rule changes must take into account how fixed-income markets operate today, including how they differ from the equity markets, to ensure unintended consequences are limited and the goal of more liquid and transparent markets is achieved without placing outsized costs on fixed-income investors.
![]()
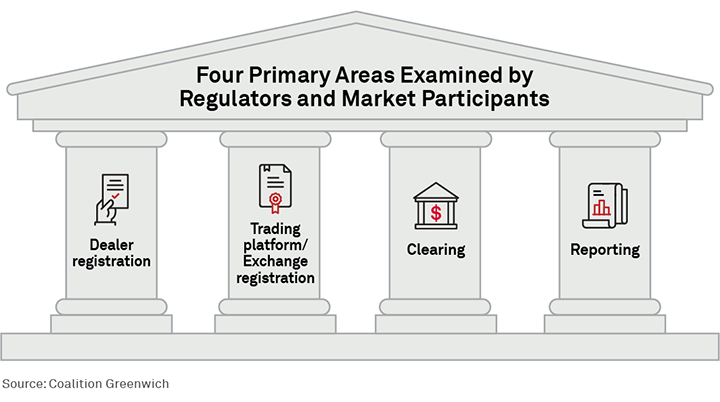
Dealer Registration
As outlined above, fixed-income dealers are overseen by the SEC, the appropriate SRO and (if the dealers are also banks) several federal bodies, including the U.S. Federal Reserve. The bond markets’ evolution over the past decade has seen the role of nonbanks—asset managers, hedge funds, principal trading firms, and others—grow considerably. This is due to both the increased accessibility of these markets and financial crisis-era rules that have limited the ability of the largest banks to use capital to make markets for their clients.
On March 28, 2022, the SEC proposed a pair of rules aimed at principal trading firms (PTFs, or “prop” trading firms), which provide liquidity and other dealer-like functions. In short, these firms would be required to “register with the SEC, become members of a self-regulatory organization (SRO), and comply with federal securities laws and regulatory obligations,” similar to the requirements imposed on broker-dealers. The scope of the rules also includes hedge funds.
While on the surface it makes sense that major providers of market liquidity should be closely overseen by the markets’ primary regulators, casting a net that captures investment advisors and non-PTFs could spawn unintended negative consequences. Hedge funds, for instance, trade based on market conditions, volatility, bid-ask spreads, and numerous other statistical elements that often result in heavy trading volumes. But this trading activity is designed to meet investment objectives and increase returns for investors in those funds, not to provide market liquidity.
With that in mind, U.S. Treasury investors forced to register as market makers under currently proposed rules could find that burden too great, forcing them to stop trading in the Treasury market, which would hurt, not help, market liquidity.

![]()
Trading Platform/Exchange Registration
Roughly 40% of the corporate bond market and two-thirds of the U.S. Treasury market now trade via multi-dealer trading platforms. A number of these trading platforms are registered with the SEC as alternative trading systems (ATSs), such as ICE Bonds and Tradeweb Direct, while others are registered as broker-dealers (e.g., MarketAxess), all operating on a riskless principal and fully electronic basis. In the latter case, an electronic trading platform helps the buyer and seller to find each other, and then that platform’s broker-dealer buys from the seller and sells to the buyer.
A few inconsistencies exist in this current regulatory regime, which was largely developed before e-trading became common in the bond markets. First, government securities platforms are, for the most part, exempt from ATS rules. In other words, trading venues for U.S. Treasuries that would have otherwise met the requirements to be an ATS are not currently required to register as such.
Second, trading venues that operate an RFQ model are not currently required to register with the regulatory bodies outlined above. RFQ markets help the buyer and seller find one another, but, ultimately, that trade is executed and cleared bilaterally. Until recently, this trading-venue function was viewed as a communication channel (i.e., automating the phone process) rather than an exchange-like function.
SEC-proposed rules in 2022 look to both require government securities platforms to register as ATSs (Form ATS-G) and to require RFQ-based platforms to register as either an ATS or an exchange. A new designation was also proposed, “communication protocol systems,” but was left largely undefined in the proposal’s text.
That said, some debate still exists as to what will be included in these new and/or redefined designations. For instance, execution management systems (EMSs) are used by investors to manage the various bond orders they need to execute throughout the day. To do this, these EMSs aggregate available liquidity from multiple trading venues as well as securities prices sent directly from dealers. The current SEC proposal suggests these EMSs would then need to register as an ATS or exchange even though they are not liquidity venues in their own right.
Ultimately, while trading venue oversight must evolve alongside technology and the market, the path forward must encourage, not stifle, innovation, while ensuring a level playing field for market participants and trading venue operators.
![]()
Clearing
Clearinghouses in capital markets sit in the middle of cleared trades, as the buyer to every seller and the seller to every buyer. That means that two trading counterparties do not have to worry about the other defaulting on their commitment to buy or sell, as the clearinghouse effectively guarantees the trade once it has been agreed upon by the original counterparties. The clearinghouse offers this service based on rigorous risk management practices that require clearinghouse members to post collateral based on their trading positions and to be sufficiently capitalized, among other similar requirements.
Clearinghouses also have stringent default management processes, consisting of substantial member-contributed initial margin and variation margin (both of which are pre-funded) based on each individual member’s positions and adjusted for market factors (volatility, size of position, etc.).
Only 20% of the U.S. Treasury market is cleared today,6 the majority between primary dealers. Many market participants have advocated for more access to U.S. Treasury clearing over the past several years in the hope that it improves market access, allowing more firms to trade with one another without the need for bilateral trading agreements among all. As such, the SEC proposed in 2022 a rule that would significantly increase the volume of trades cleared in the Treasury market.
While clearing addresses certain types of risk (e.g., reducing bilateral counterparty risk via central clearing in the swaps market following the global financial crisis), the exact scope and timing of any requirement are crucial, as are the potential added costs for market participants. Clearing reduces risks in many cases, but it also adds costs for market participants. The complexity and cost of managing collateral, especially once clients begin to clear, is also non-trivial, as can be seen via clearinghouses for swaps, futures and other derivatives.
And lastly, given the systemic importance of the U.S. Treasury market to the global economy, any changes in the post-trade process must be approached cautiously. Unintended consequences could cause market participants to trade less, ultimately hurting liquidity for end investors, for instance. Further, counterparty risk in the U.S. Treasury market is limited to the 1-day settlement period, leaving clearing’s impact to be less than in futures markets, where contracts between counterparties can last years.
![]()
Reporting
Public reporting of corporate bond trades via FINRA’s TRACE system started on July 1, 2002. Now, over two decades later, the U.S. corporate bond market has proven to be the blueprint for bond market transparency around the world. TRACE reporting has changed over time to keep up with the market’s evolution, with more trades being reported more frequently and with increasing levels of detail. For instance, FINRA has updated its methodology for the reporting of ATS trades, with a goal to improve accuracy in this increasingly electronic world.
Municipal securities dealers have been required to submit trade reports to the MSRB’s RTRS system since January 2005. At the time, SIFMA’s predecessor, The Bond Market Association, was the only website that provided real-time access to the MSRB trade reports. The MSRB7 added its EMMA transparency system in 2008.
In 2018, FINRA started collecting trading data from the U.S. Treasury market—a big step forward for transparency into one of the most important markets in the world. In 2023, this reporting of Treasury trades will transition from weekly to daily dissemination of aggregate trading volumes, giving market participants and observers even more clarity into market activity day to day.
For much of the corporate, MBS/ABS, and municipal bond markets, a proposal has been put forward to reduce the trade reporting time limit from the current 15 minutes to 1 minute. While the largest market participants reporting trades in the most liquid instruments frequently meet these standards today, small and midsize market participants and those trading in less-liquid bonds or in larger trade sizes may find the proposed 1-minute reporting requirement an impossible task. For example, the roughly 60% of trade volume executed manually via voice would prove difficult if not impossible to report in near-real time and may lead some firms to exit these markets.
Appendix
Kevin McPartland is the Head of Research for Market Structure & Technology at Coalition Greenwich.
Katie Kolchin, CFA, is Head of Research at SIFMA.
1SIFMA
2Coalition Greenwich
3LSEG Refinitiv data
4Greenwich MarketView
5https://www.preqin.com/insights/research/reports/future-of-alts-2027-private-debt
7https://msrb.org/Market-Transparency
MethodologyThis research is based on numerous industry sources, including Coalition Greenwich primary research, Greenwich MarketView, SIFMA, the U.S. Federal Reserve, Bloomberg, ICE Data Services, and others. Coalition Greenwich data is based on interviews with thousands of fixed-income market participants over the past decade, including asset managers, hedge funds, pension funds, insurance companies, and fixed-income broker-dealers.


